Open Interest as a Map for Weekly Trading
Last week I wrote here about taking Thursday's open interest and using it to help you find a range to trade Fridays stock action. The point was to see how well pinning worked using open interest. This week I decided to start a little earlier and begin looking at the range in OI after Monday. Perhaps if you could get a road map of the range a stock will likely trade in a few days before Friday expatriation, you can use that information to help you look for intra-day or intra-week set-ups. Having said that, I would not recommend using Tuesday mornings open interest to make pin predictions for Friday. One more thing I want to note is that I realize this information is all in hindsight and therefore seems less relevant; however, my purpose for right now is just to get some information on how well using open interest to gauge Friday's pin works. Armed with information about the past is after all how technicians developed chart patters.
I again took a few high beta momentum stocks as well as the SPY to assess the potential for finding probable ranges. I will highlight the ranges by showing a chart for OI on Tuesday morning (10/2) and Friday morning (10/5). I will also highlight what each stocks traditional maxpain is (using the iMaxPain application) as well as where the closing price was on both Monday and Friday.
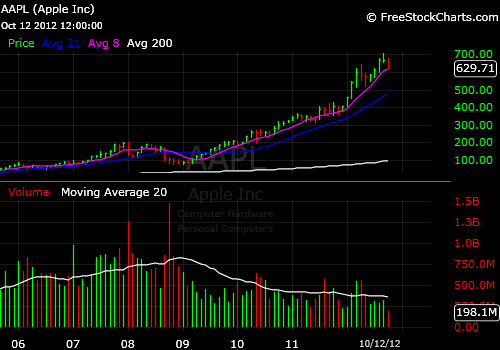
Let's again begin with AAPL
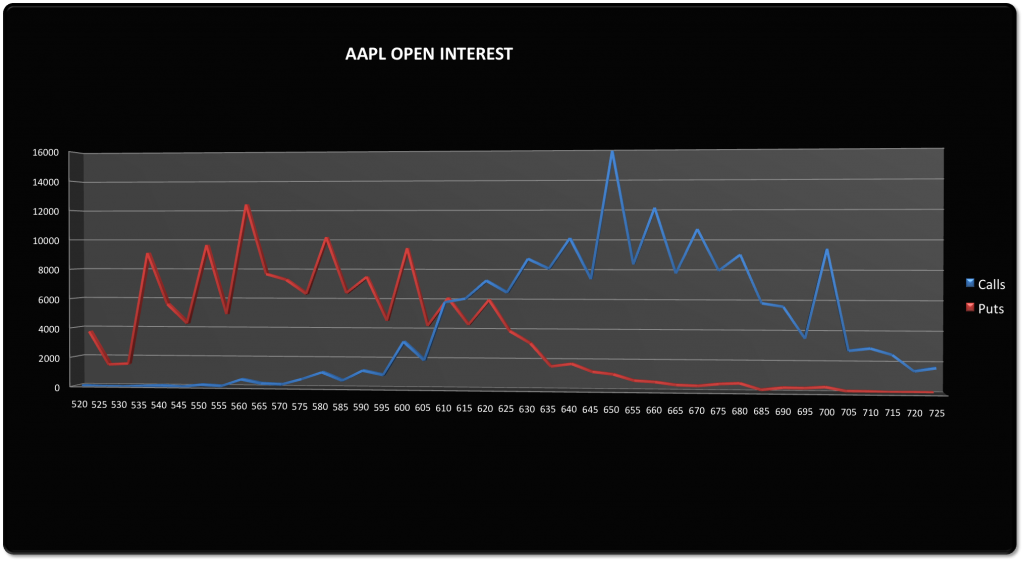
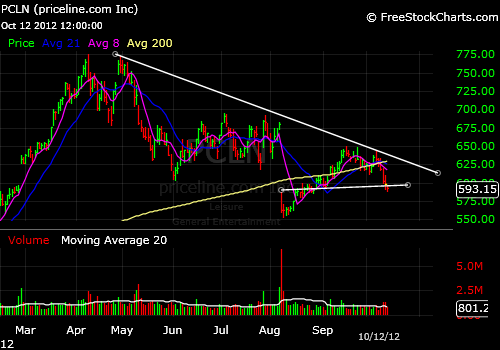
Monday's closing price: 659.39
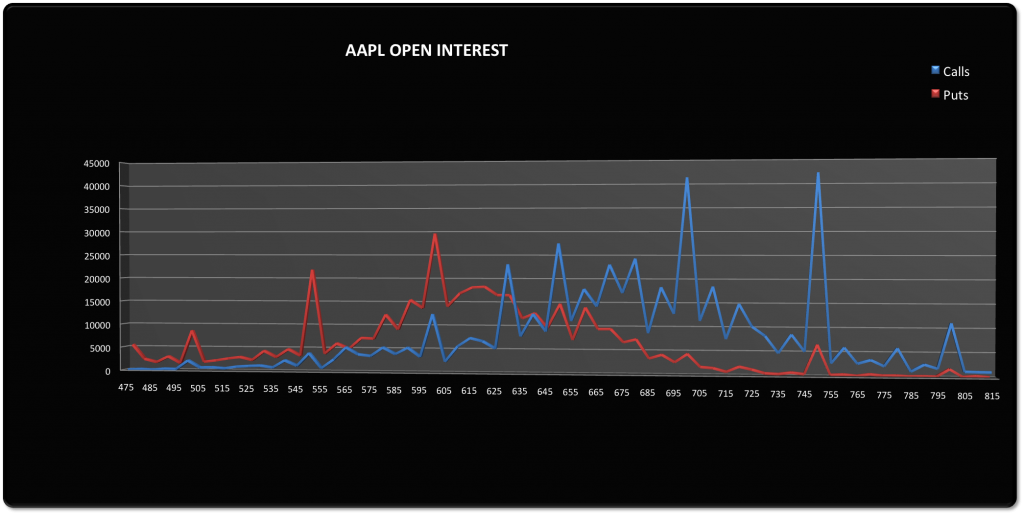
Tuesday 10/2 Open Interest:
From Monday’s close (Tuesday’s open), the highest call OI was at
680; however there was an almost equivalent number of open calls at 670. The highest OI on the put side
was 640. So if I were to keep a range in the back of my mind on Tuesday it
would be from 640 to 670. Although that seems large, given the extreme moves
AAPL can make in just a day it does seem to provide a little framework
(especially when using other technical’s such as moving averages etc.). The calls and puts crossed at 665.
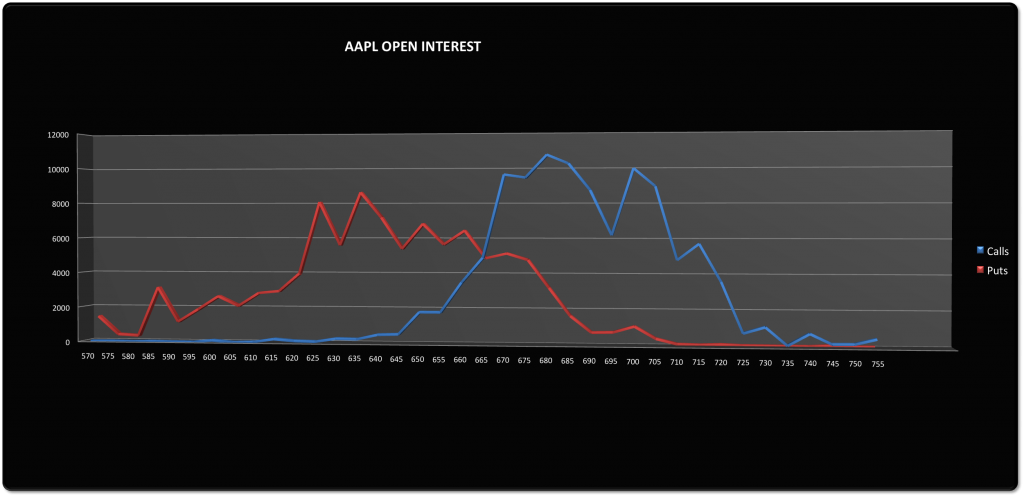
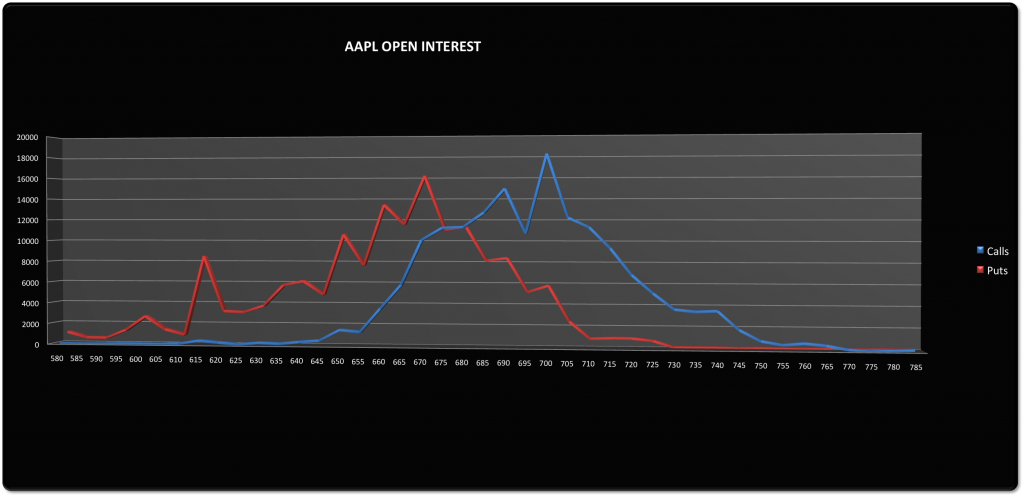
AAPL Friday 10/5
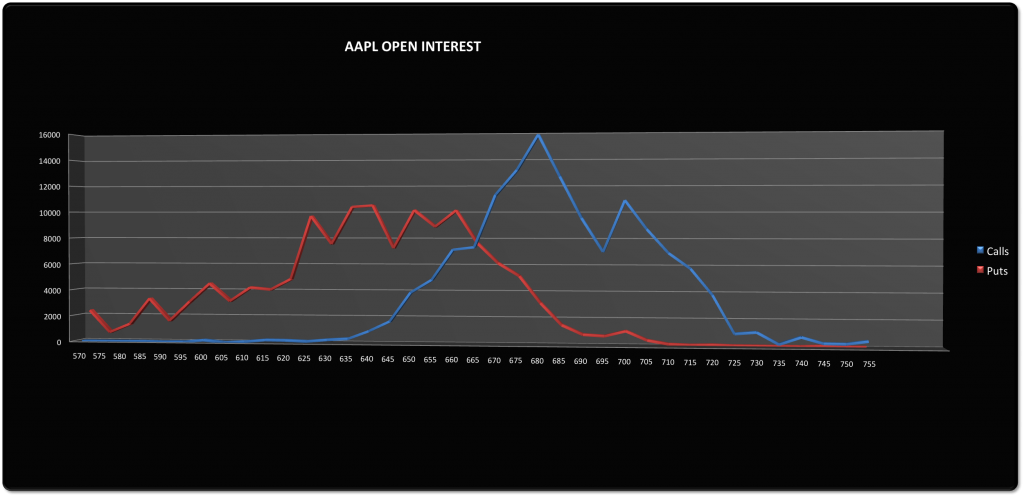
Friday 10/5 Open Interest:
As you can see the highest OI on the call side was 680, then
675 followed by 670. All three were significantly higher than the highest put side at
660. They crossed closest to the 665 strike. From the steep OI on the
call side and knowing AAPL’s history on expiration day, it seemed fairly
certain that AAPL only had down to go. And since there was no put strike that
truly dominated, there wasn’t much to stop it on the way down.
Maxpain was 665
AAPL closed at 652.59
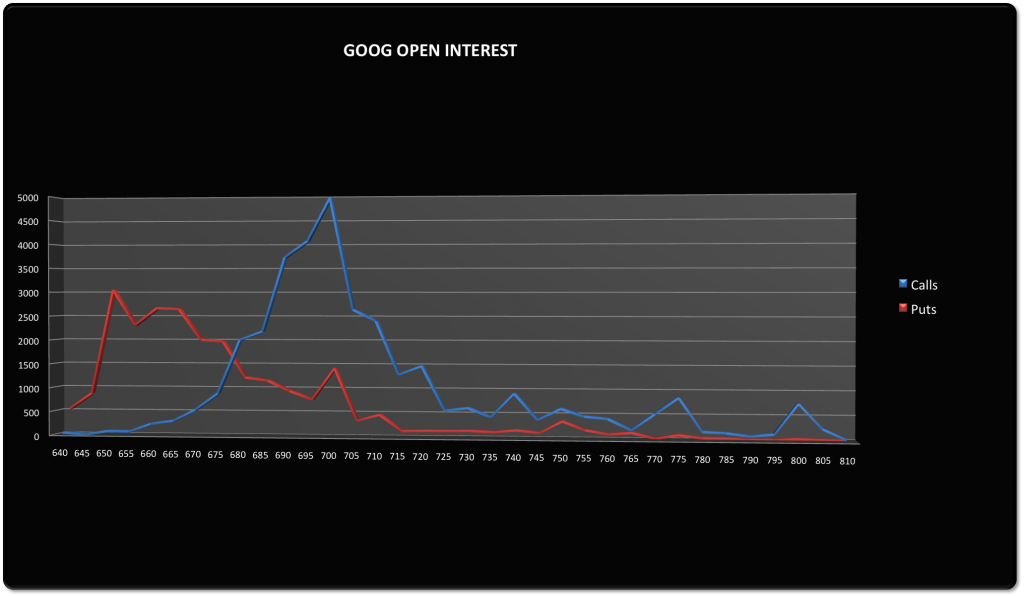
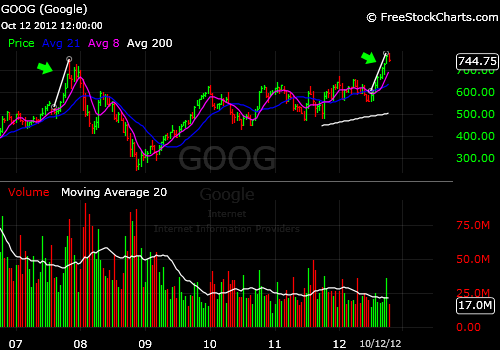
GOOG
GOOG Tuesday 10/2
Monday's closing price: 761.78
Tuesday 10/2 Open Interest:
If looking at AAPL’s OI it seemed like there was a good
chance it could go lower, GOOG’s would leave you to presume that it was going
to remain where it was or go higher. The highest OI on
the call side was 760, but it was substantially lower than the highest put OI at 750. If I were to imagine a range based on OI, I would have made it 750 to beyond as there wasn’t anything substantial on the call
side preventing it from going higher. The calls and puts crossed at 760.
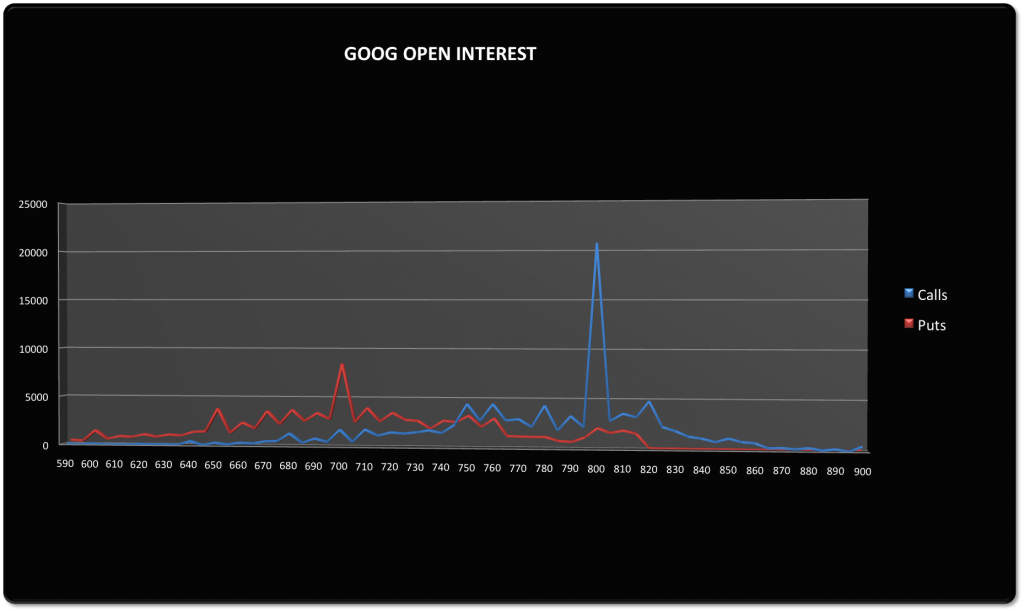
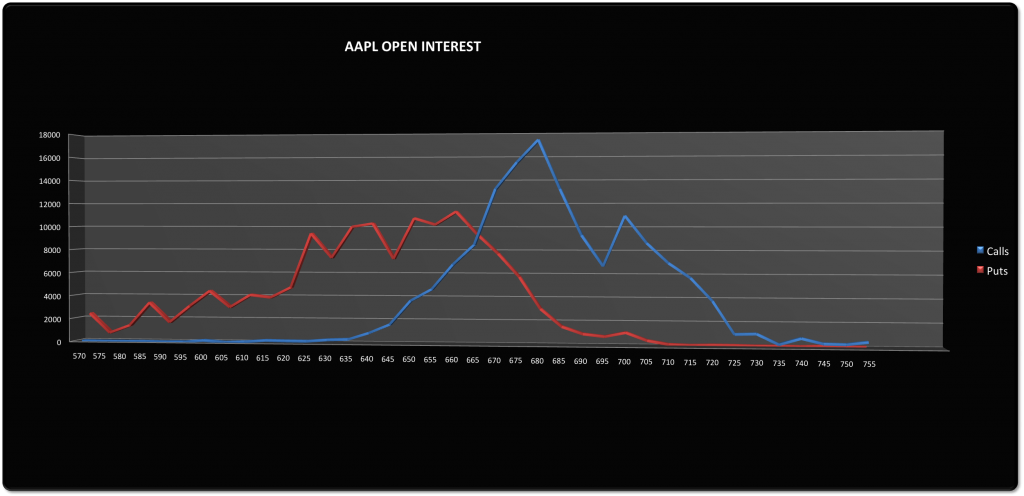
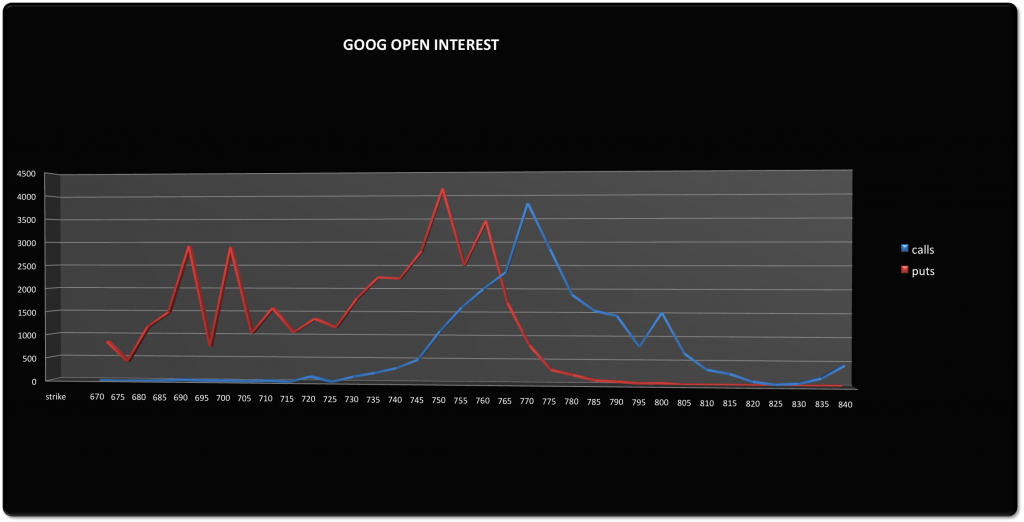
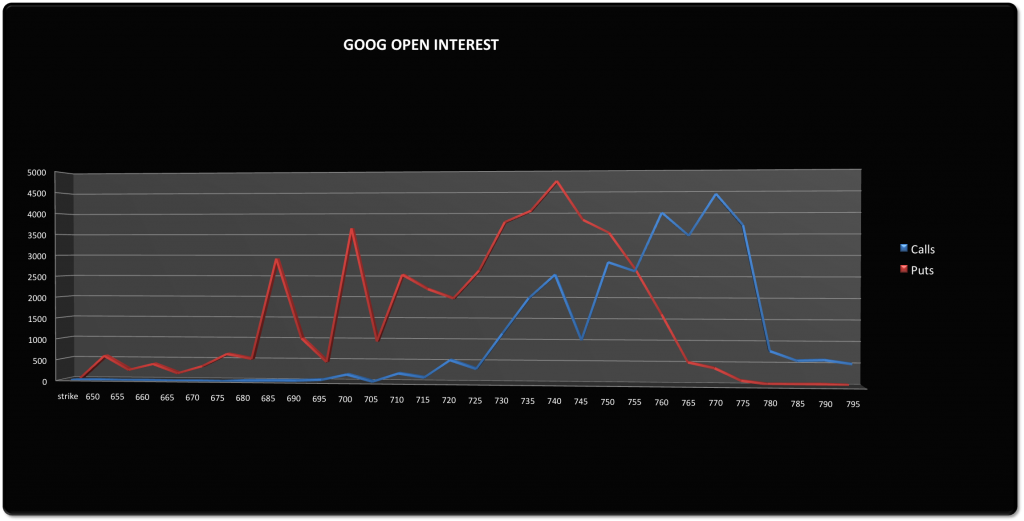
GOOG Friday 10/5
Friday 10/5 Open Interest:
Throughout the week the call side built up and the highest
OI was at 770. The highest put side remained at 750; however a considerable
amount of puts also built up at 760. The calls and puts crossed at 765.
Maxpain was 760
GOOG closed at 767.65
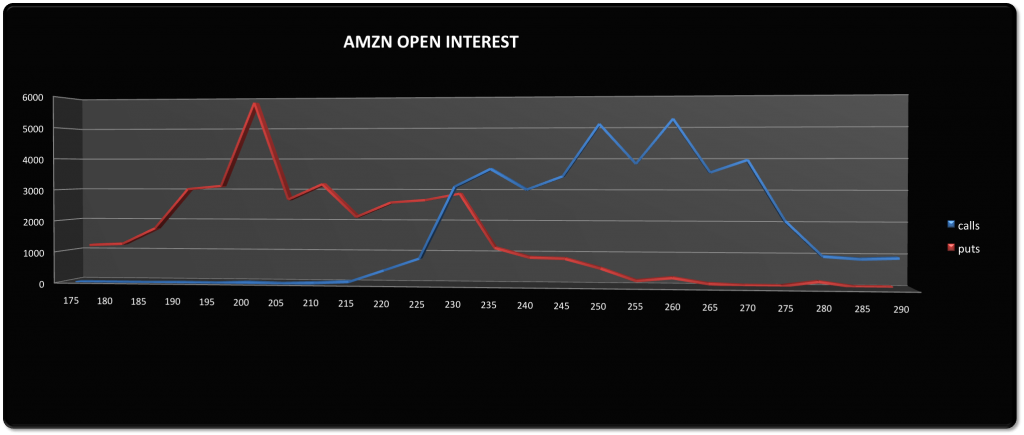
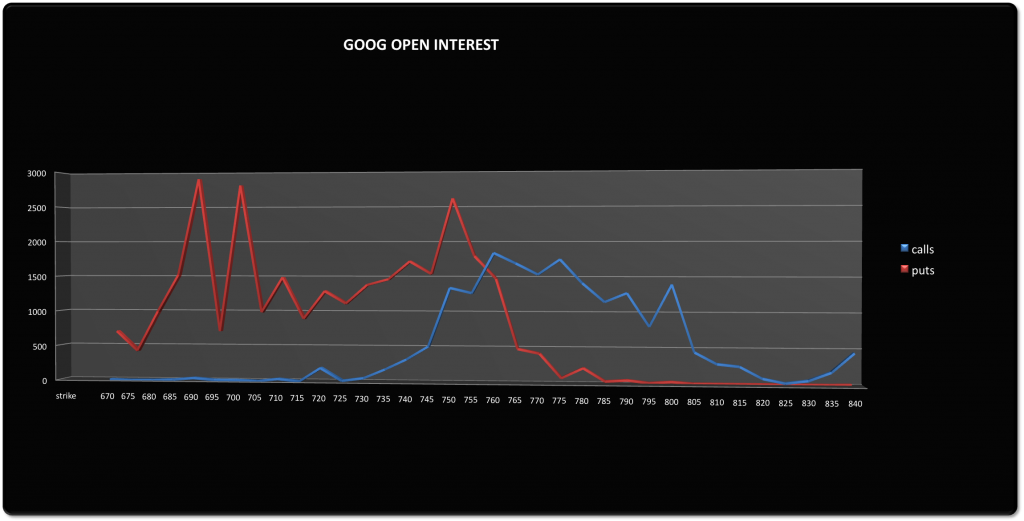
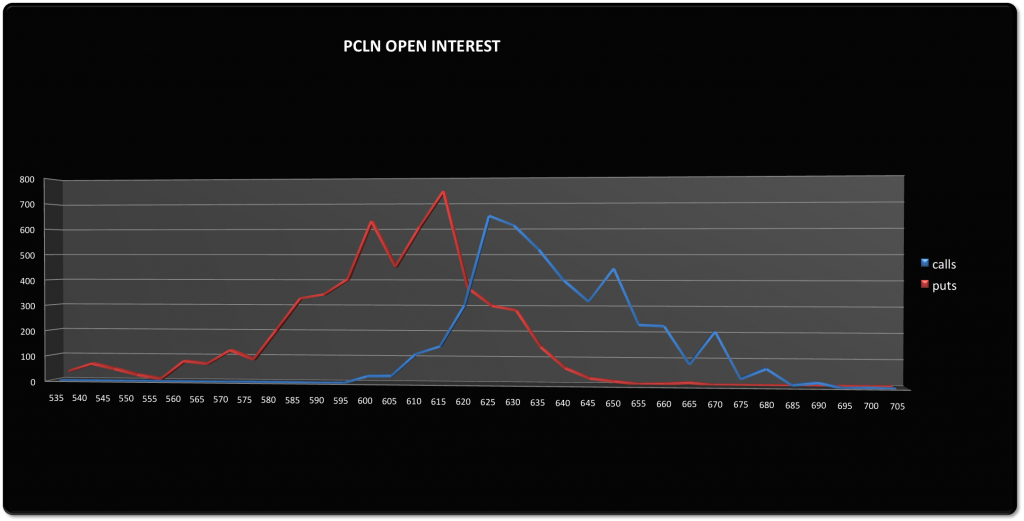
PCLN Tuesday 10/2
Monday's closing price: 631.18
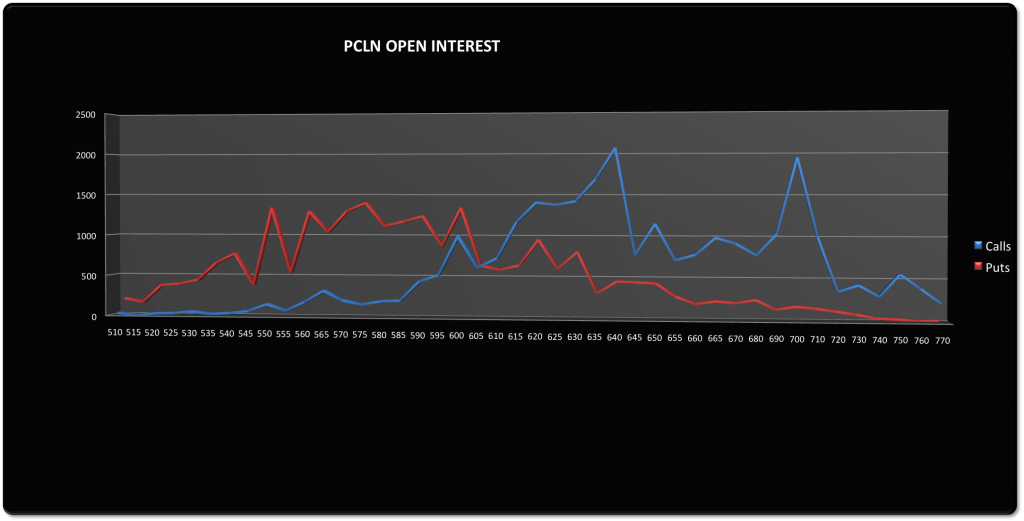
Tuesday 10/2 Open Interest:
The highest OI on the call side is 625. The highest OI on the put side is 615. The call and puts cross at the 620 strike. From the chart of PCLN the range would appear to be between 615 and 625; however knowing PCLN is subject to fairly volatile moves and the highest OI for either side is less than 1000 it would definitely have been risky using such a narrow range this early into the week.
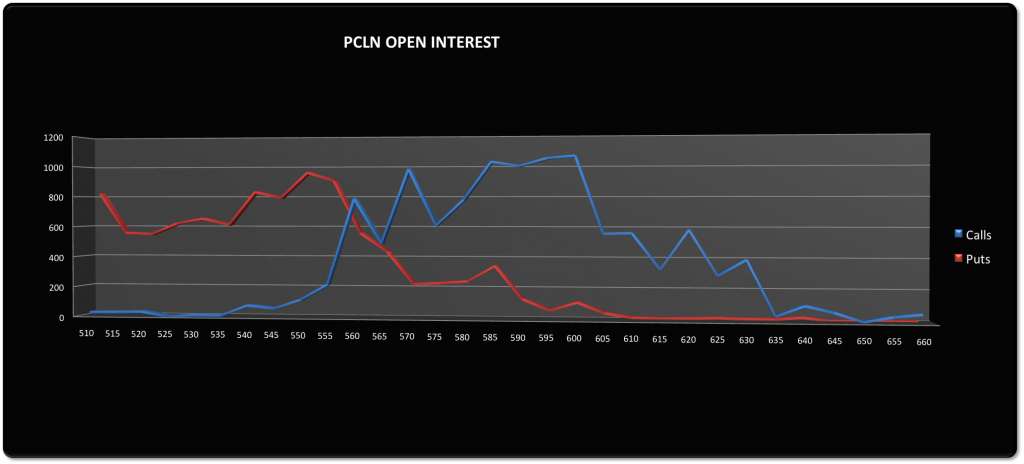
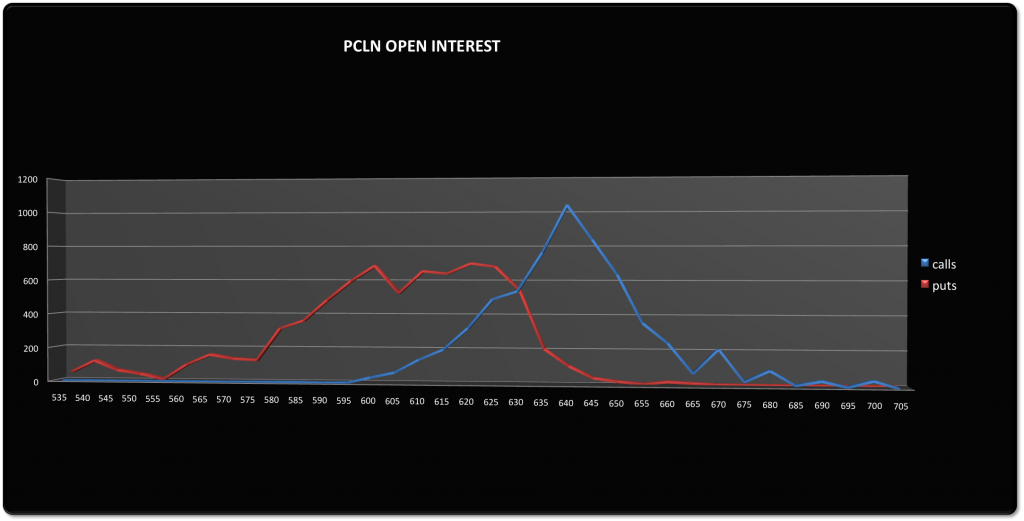
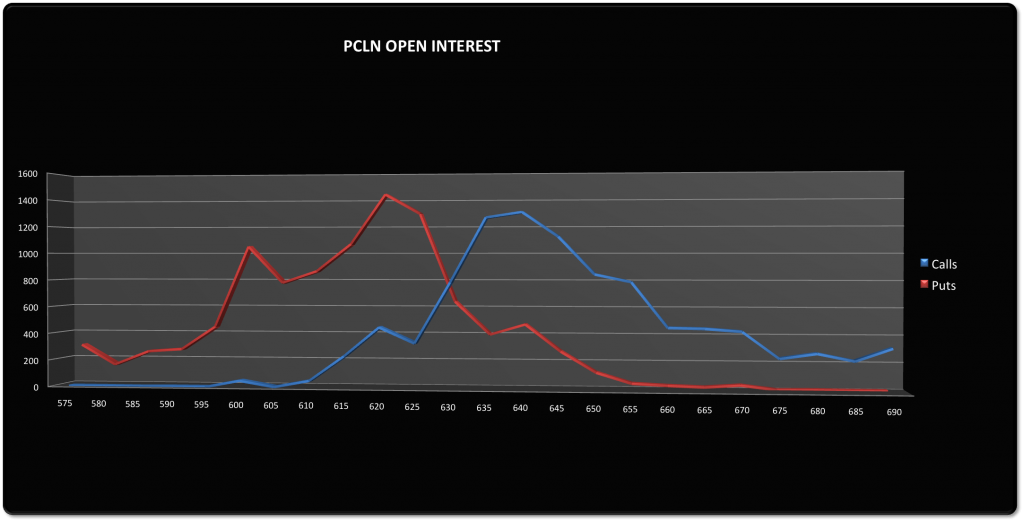
PCLN Friday 10/5
Friday 10/5 Open Interest:
The highest call OI had not only grown substantially, but moved to 640. The highest put OI, which represented only about a third of the call side was at 620. Just based on OI Friday morning it seemed that PCLN would not get over 640 and would likely drift down to either where they crossed between 630 and 635 or lower since there wasn't a substantial put OI that had built up.
Maxpain was 625
PCLN closed at 631.89
What was interesting about PCLN is that there was a fair amount of bullish sentiment on twitter Thursday evening and Friday morning and it did in fact reach a high of 643.88 early in that morning. With this OI information you may have had pretty good probability short.
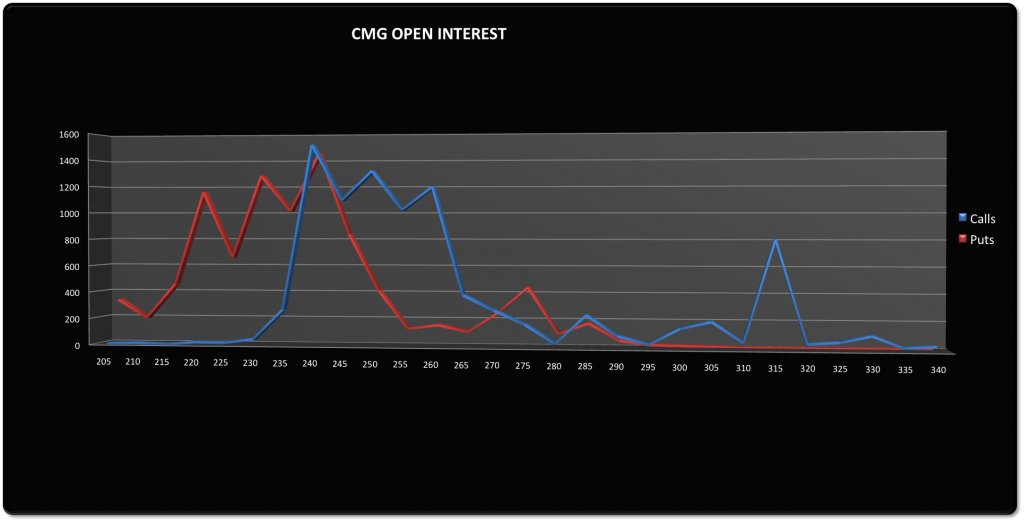
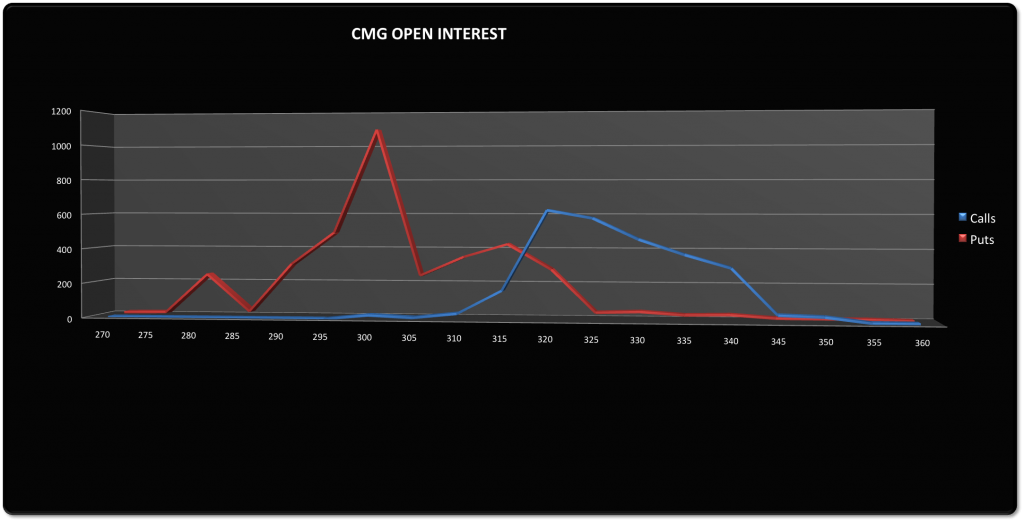
I decided to throw CMG in because I thought it would be interesting to demonstrate how events, earnings, or news can throw pinning out the window. On Tuesday (after OI had a couple days to begin to develop a range), hedge-fund manager David Einhorn threw CMG under the bus by saying it would be wise to short.
CMG Tuesday 10/2
Monday's closing price: 316.13
Tuesday 10/2 Open Interest:
The highest call OI was 320. The highest put OI was at 300 and was substantially higher than the call side (maybe someone could read Einhorn's mind or something like that...). Based on the OI on the close Monday it would have seemed that CMG would have had room to trend higher.
CMG Friday 10/5
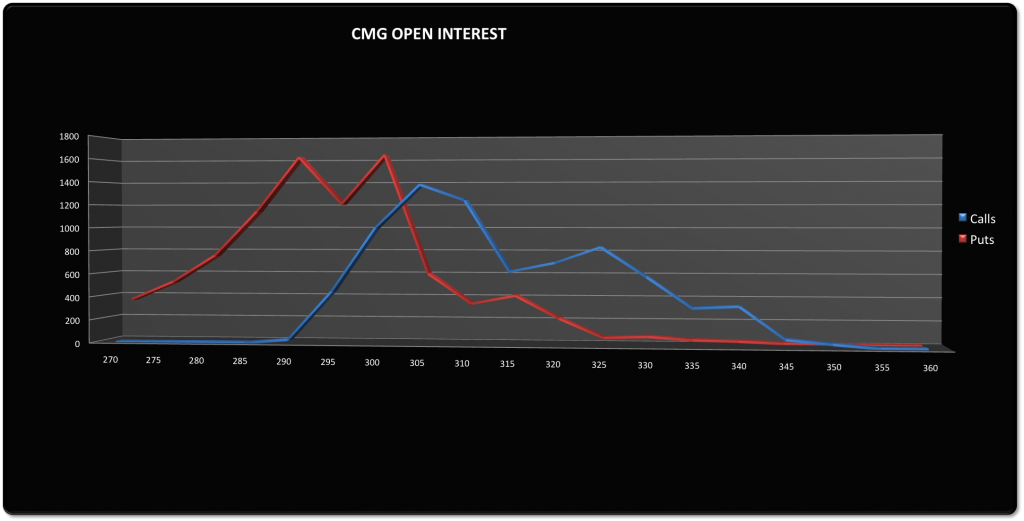
Friday 10/5 Open Interest:
The
highest call OI had grown substantially and was at 305. The highest put
OI had also grown, but remained at 300, with an almost equally high
amount at 290. They crossed close to the 305 strike. Based on the OI information it
would have seemed that CMG would not have closed under 300. However,
this is a good lesson regarding events, news etc. They change the
dynamic and you need to be prepared for anything and everything.
SPY Tuesday 10/2
Monday's closing price: 144.35
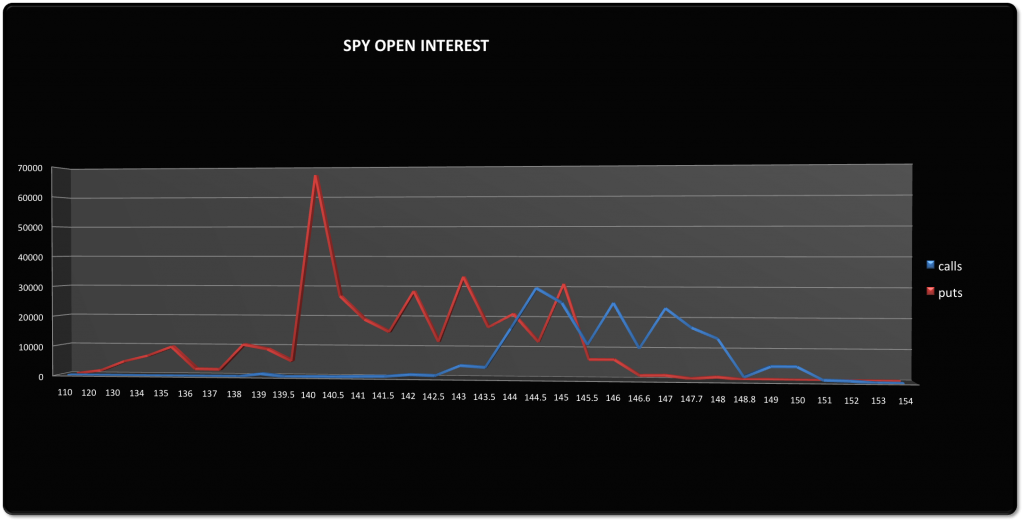
Tuesday 10/2 Open Interest:
The highest call OI was at 144, which was not even half of the highest put OI at 140. As of Monday's close it would have seemed like the SPY had room to move in both directions, but would likely not get below 140.
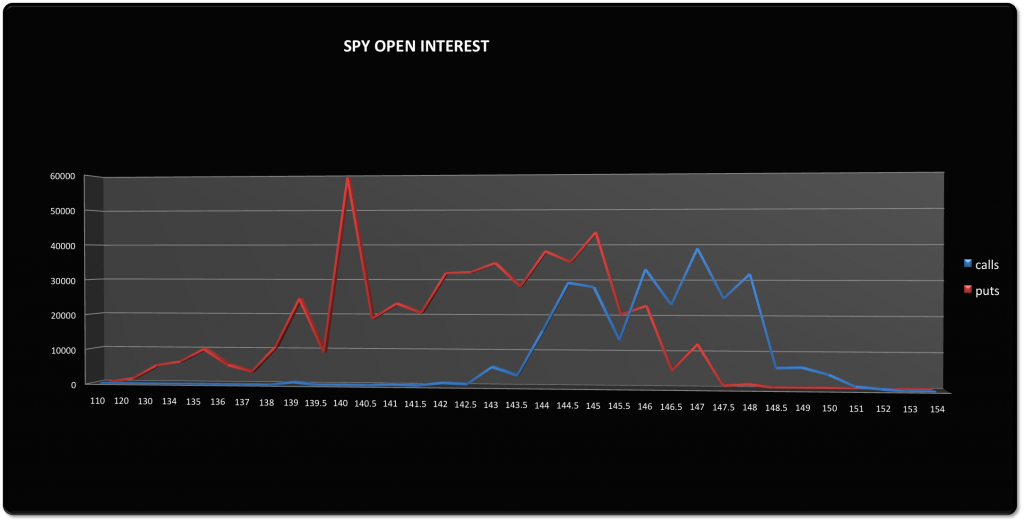
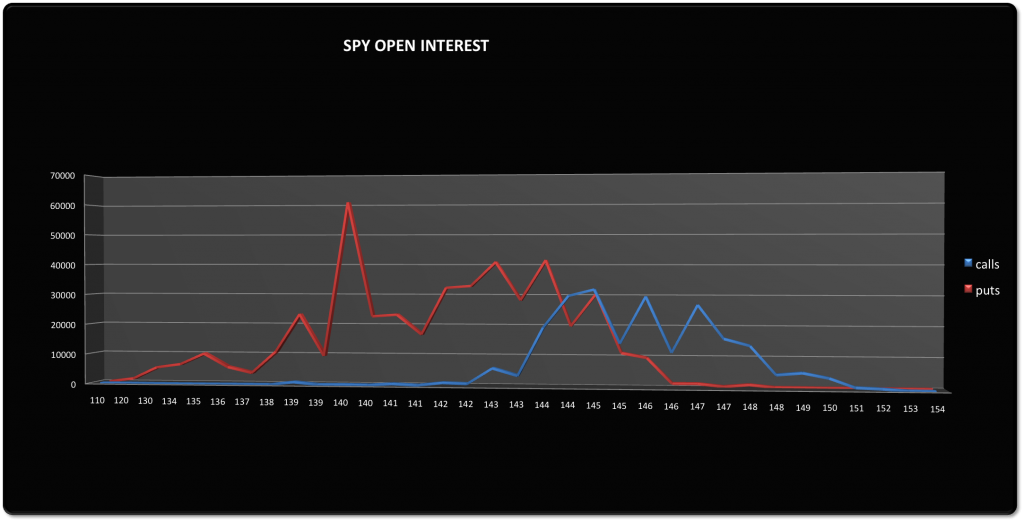
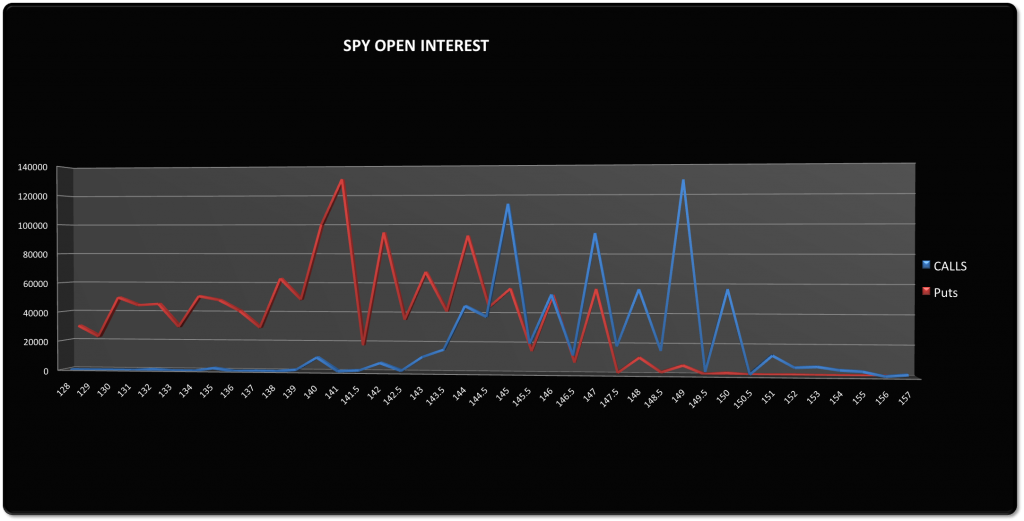
SPY Friday 10/5
Friday 10/5 Open Interest:
The highest call OI was at 147, closely followed by 146. The highest put OI remained at 140, but the second high at 145 had also built up considerably. They crossed between 145.50 and 146.
Maxpain was 145.50
SPY closed at 146.14
Having looked over the data it does appear that each stock stayed fairly close within it's general range using the OI from Monday with the exception of CMG. As I mentioned in a previous blog, I intend to continue to track OI and start to look for ways to find set-ups during the week.