Where the  Drops
Drops
Drops
Open Interest & Weekly Expiration
Anytime a trader uses the word “likely,” “probably” or “should” etc., there is an inherent risk involved. To assume that your stock will pin at a so-called price carries that risk. In order to try to increase your chances of correctly identifying the stock price at the end of the day Friday, it may be a good idea to look at each stocks open interest (OI). By doing so, it may be easier to find a range instead of one number. Lets look back to last week (9/28/12) at some large cap momentum stocks as well as some less popular liquid stocks to see how you would have fared using OI to determine a range versus using maxpain (note: all maxpain numbers come from the iMaxPain application).
Let’s of course begin with AAPL
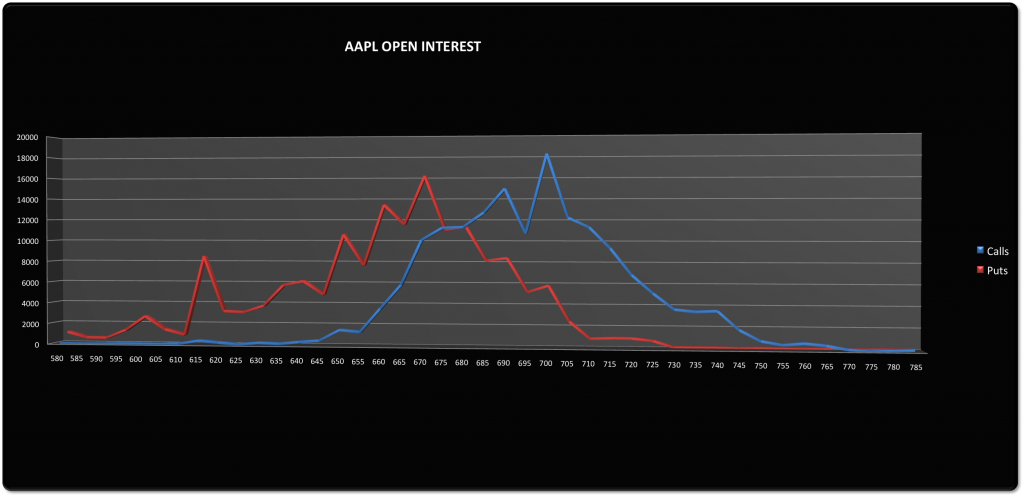
AAPL’s range based on its highest OI was 665 – 700. However, we can narrow that down a bit more to 665 – 690 by using the 2nd highest OI on the call side, which likely stands in the way of the price getting over it by expiration. On this graph the put and call OI meet on all points from 675 to 685.
· Maxpain was 680
· AAPL closed at 667.10
In this example knowing the OI range was more helpful than knowing the maxpain.
AMZN

AMZN’s range based on its highest OI was 250 – 260. The put and call OI met at 255.
· Maxpain was 255
· AMZN closed at 254.32
In AMZN’s case, both maxpain and using its OI would have worked well.
GOOG
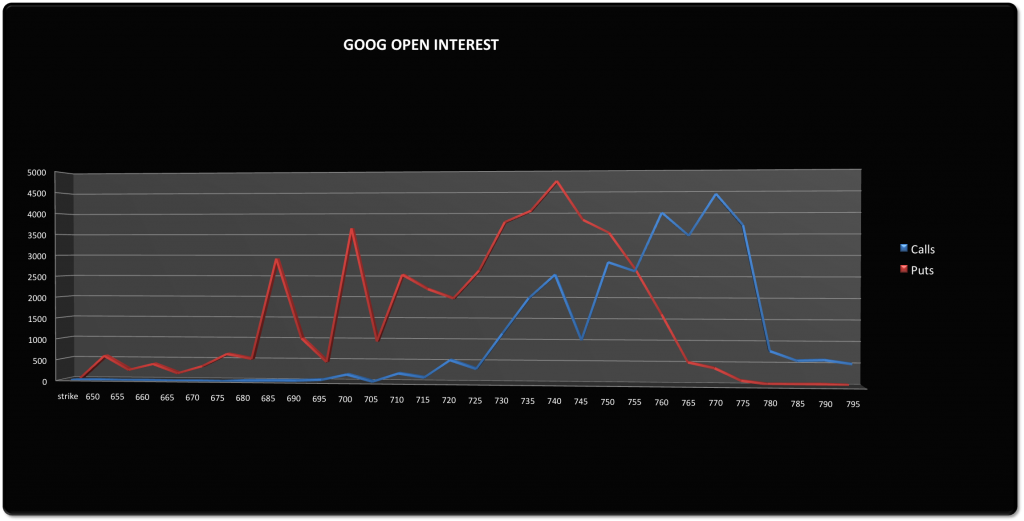
GOOG’s range based on its highest OI was from 740 – 770. Narrowing that down to a smaller range using at least 3,500 OI would take the range to 750 – 760. On this graph the put and call OI meet at 755.
· Maxpain was 750
· GOOG closed at 754.50
In this example knowing the OI range as well as where the puts and calls crossed paths was more helpful than knowing the maxpain.
PCLN
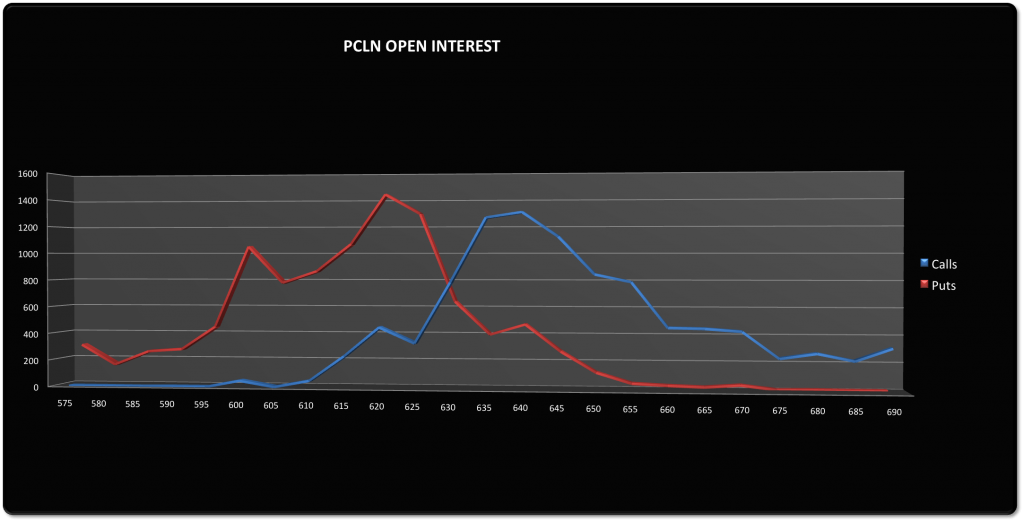
PCLN’s range based on its highest OI was from 620 – 640. Narrowing that down further to PCLN’s 2nd highest OI the range becomes 625 – 635. The put and call OI meet at 630.
· Maxpain was 630
· PCLN closed at 619.07
In this example neither using the OI range or maxpain would have been effective. However, had you used the 620 to sell puts and received at least $0.93 premium you likely would have at least broken even or yielded some income.
Given that the GLD is an ETF and that it attracts a wider base of traders, I thought it would be interesting to evaluate.
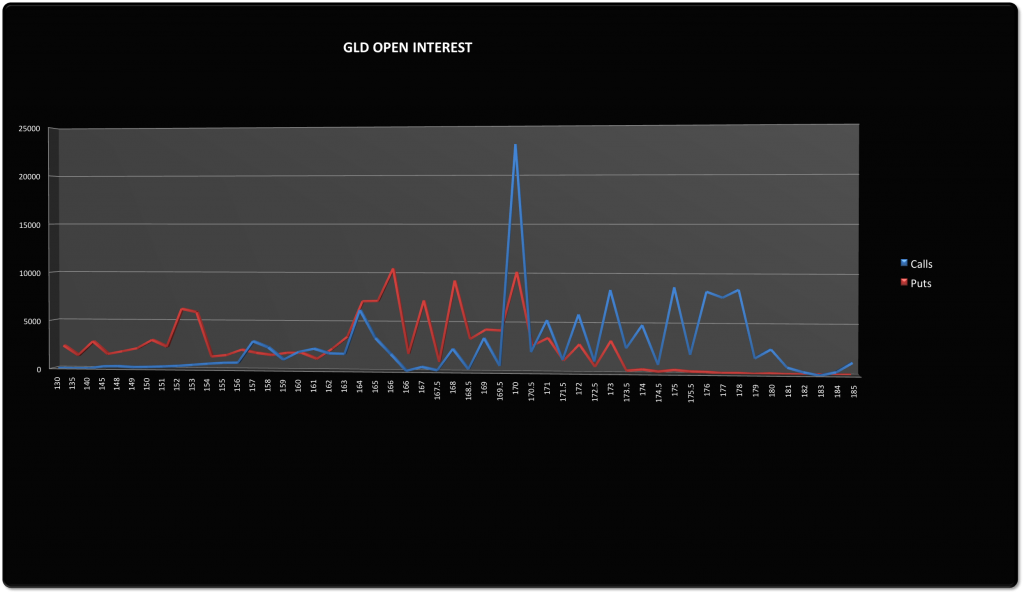
The GLD’s range based on highest IO is from 166 - 170; however, the 166 put doesn’t even come close to the huge OI at the 170 call strike. The two overlap at both 169.5 and at 170 where the calls tower over the puts.
· Maxpain was 169
· GLD closed at 171.89
Neither using OI nor maxpain would have rendered well. The enormous OI on the call side would have erroneously led to the belief that the GLD would close at or below 170 and yet enough buyers stepped in Friday to keep this ETF afloat.
Trying to forecast the expiration price of a stock using any method gets thrown out the window with events such as earnings. Nevertheless, I thought it would be interesting to look at such a stock this past week. NKE reported Thursday after the bell. Although anticipation of the earnings likely affected the OI for the week, earnings themselves could not have because OI for Thursday’s close was the last available OI for the week.
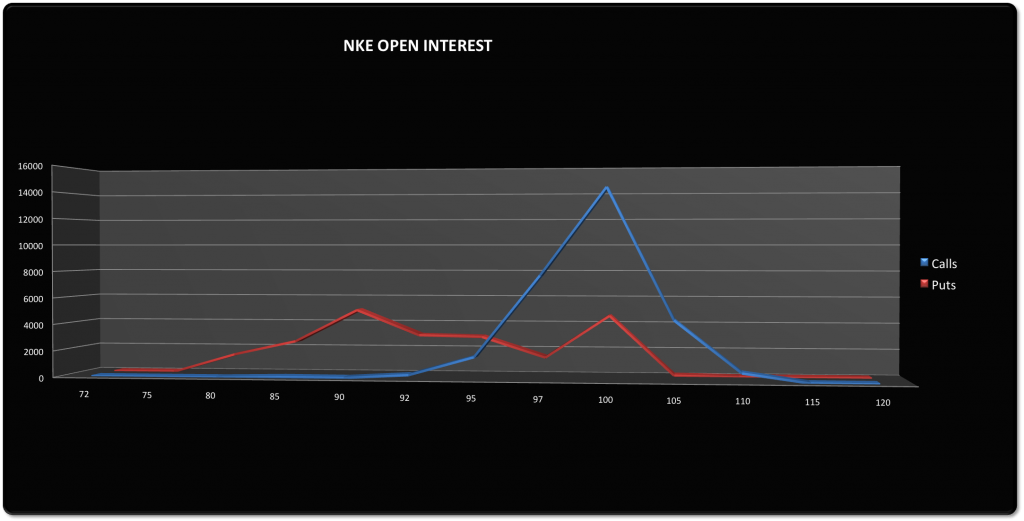
NKE’s range based on its highest OI was from 90 – 100. However, given that the put side was very low in comparison to the call side, it would have made more sense to use the overlap strike of the puts and calls, which was at 95. Furthermore, it would have been prudent to keep an eye on that 100 call OI since it was so enormous.
· Maxpain was 97.50
· NKE closed at 94.91
Despite earnings, NKE would still have been a good candidate to play by selling out of the money puts or calls using the 95 strike where they overlapped. Even if that seemed too risky, selling 100 strike calls, (which obviously a lot of people or institutions did), was a good choice given the high volatility in anticipation of earnings.
MA

MA’s range based on its highest OI was from 445 – 455. The puts and calls overlapped at 450.
· Maxpain was 450
· MA closed at 451.48
Assuming you could have taken in enough premium, either using OI or maxpain would have worked; however had you sold 450 MA call strikes you would have had to keep an eye on them and close them intraday when MA was close to 450. The safer play would definitely have been using the OI range.
JPM
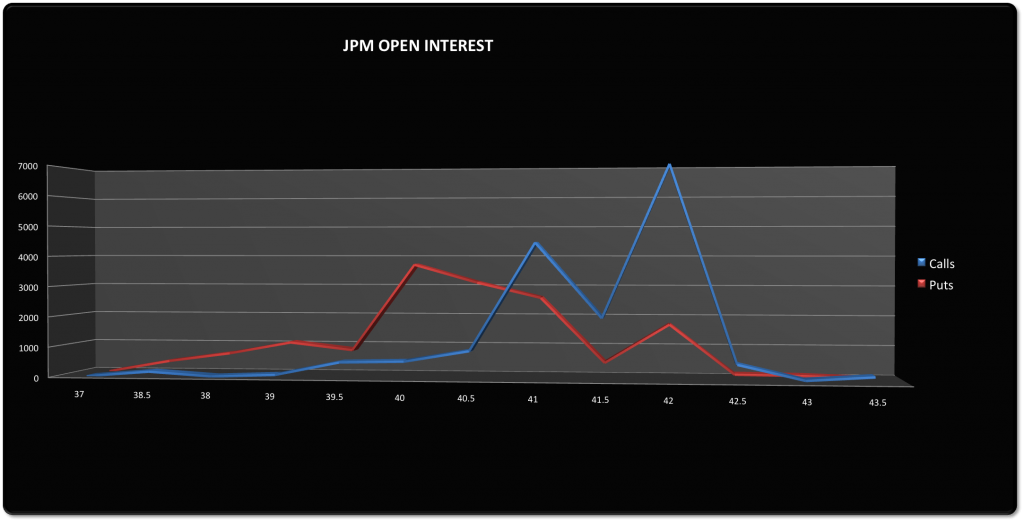
JPM’s range based on its highest OI was from 40 – 42. Narrowing the range to the highest put OI and 2nd highest call OI is 40 – 41. They cross between 40.5 and 41.
· Maxpain was 41
· JPM closed at 40.48
In this case using the highest put OI and the 2nd highest call OI would have been ideal.
And finally, I thought it would be interesting to look at the SPY.
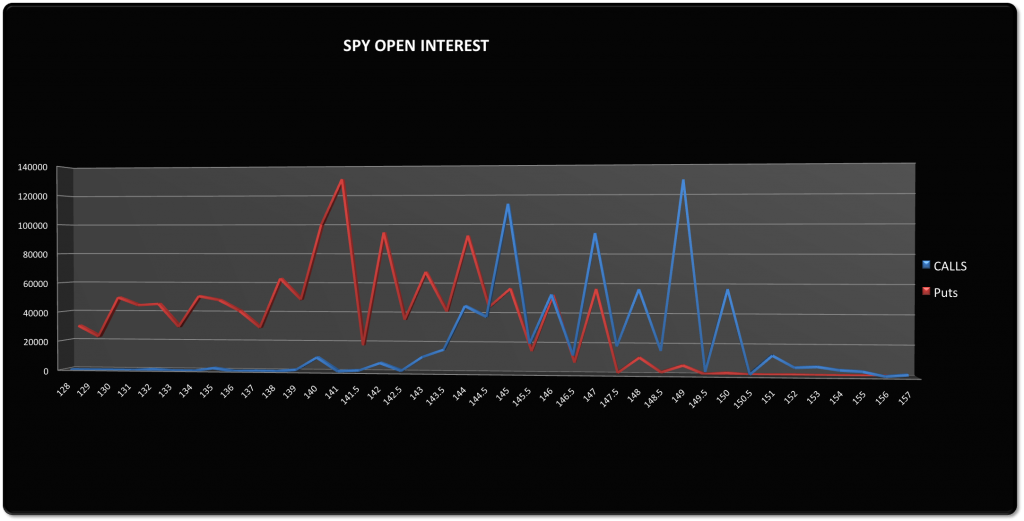
The range based on SPY’s highest OI was from 141 – 149.5. Given several high OI strikes, the range could have been narrowed to either 142.5 – 147 or possibly even narrower to 144 – 145.5.
· Maxpain was 145
· SPY closed at 143.97.
With regard to the SPY, using the 2nd range would have been ideal; however, even using the narrowest range would have worked because SPY closed $.03 shy of falling within the range of 144 – 145.5.
Thus far, it appears that using a stocks OI put and call range to create option plays could be very useful. I will look to continue to track several stocks and perhaps develop some strategies overtime to go with them.
No comments:
Post a Comment